Projects /..
A curated collection of projects exploring data, systems, and storytelling through code.
Each project includes links to the GitHub repo, a live demo (if deployed), and a write-up for deeper context.
Newest projects appear first.
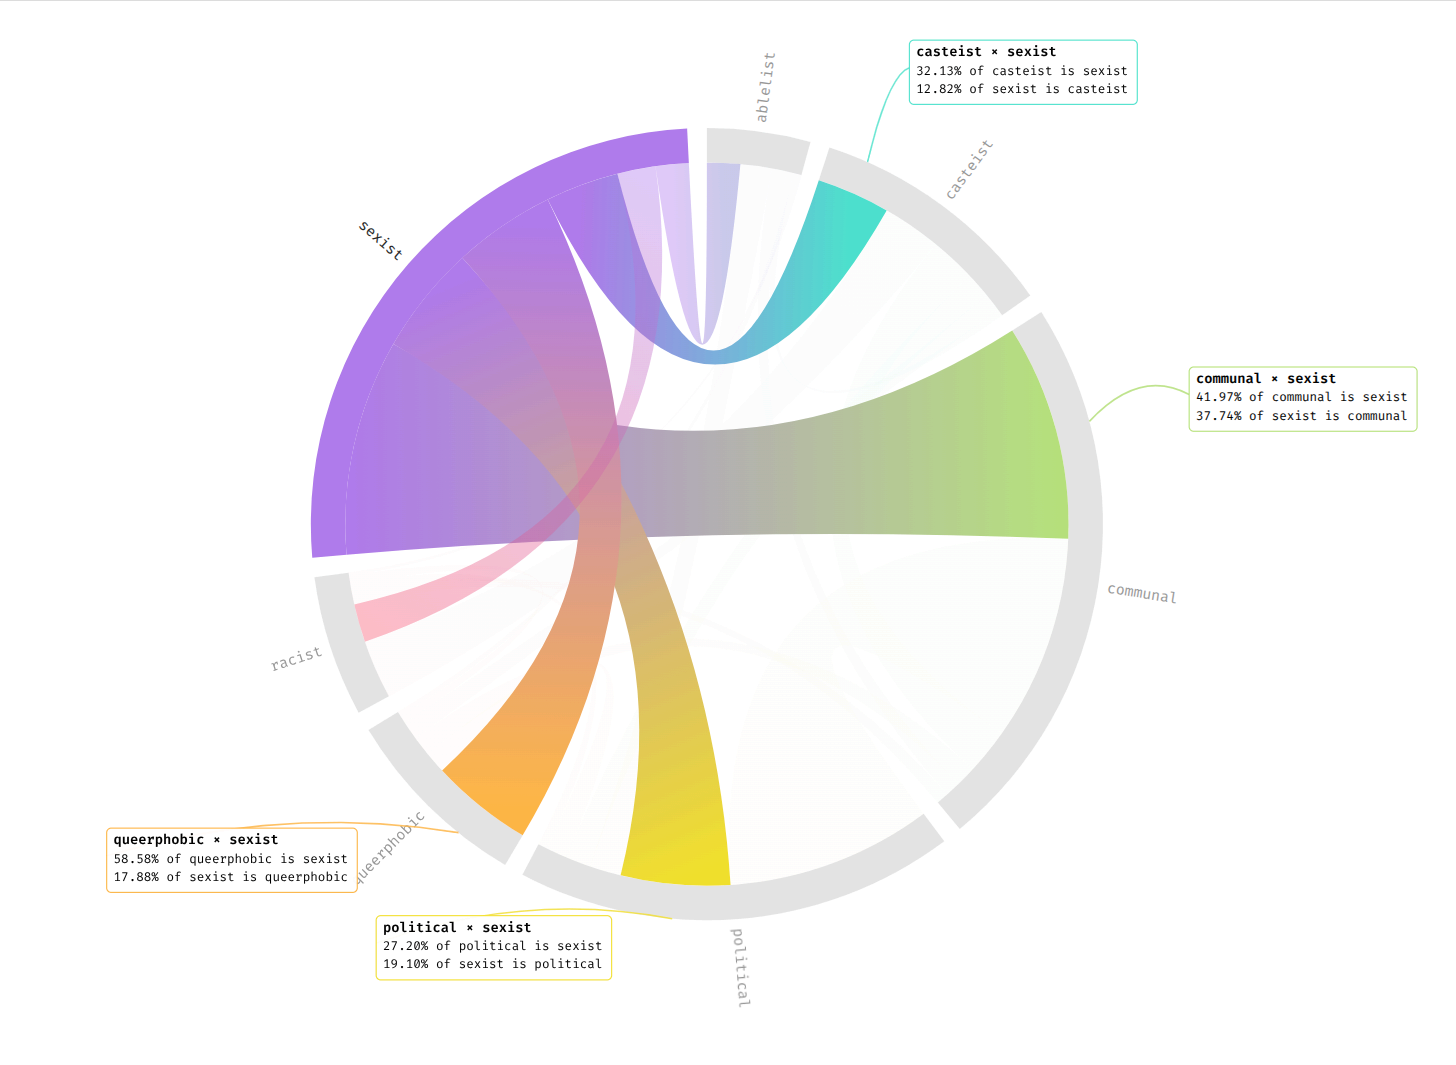
Intersections of Hate — Chord Diagram Story
A scrollytelling data visualization built with D3.js that explores the interconnected nature of online hate speech.
As users scroll, the chord diagram transitions through stages — highlighting how sexist, political, and communal hate speech overlap across narratives.
Tech: D3.js, JavaScript, HTML, CSS, Data Visualization, Scrollytelling UX
Added: Dec 2025

rawring-riha — Personal Portfolio
A minimalist personal site built with Hugo and customized from the Terminal theme.
Designed for clarity and speed, it showcases data-driven storytelling, research, and creative work — wrapped in a clean, command-line aesthetic.
Tech: Hugo, HTML, CSS, GitHub Actions, Markdown
Added: Nov 2025
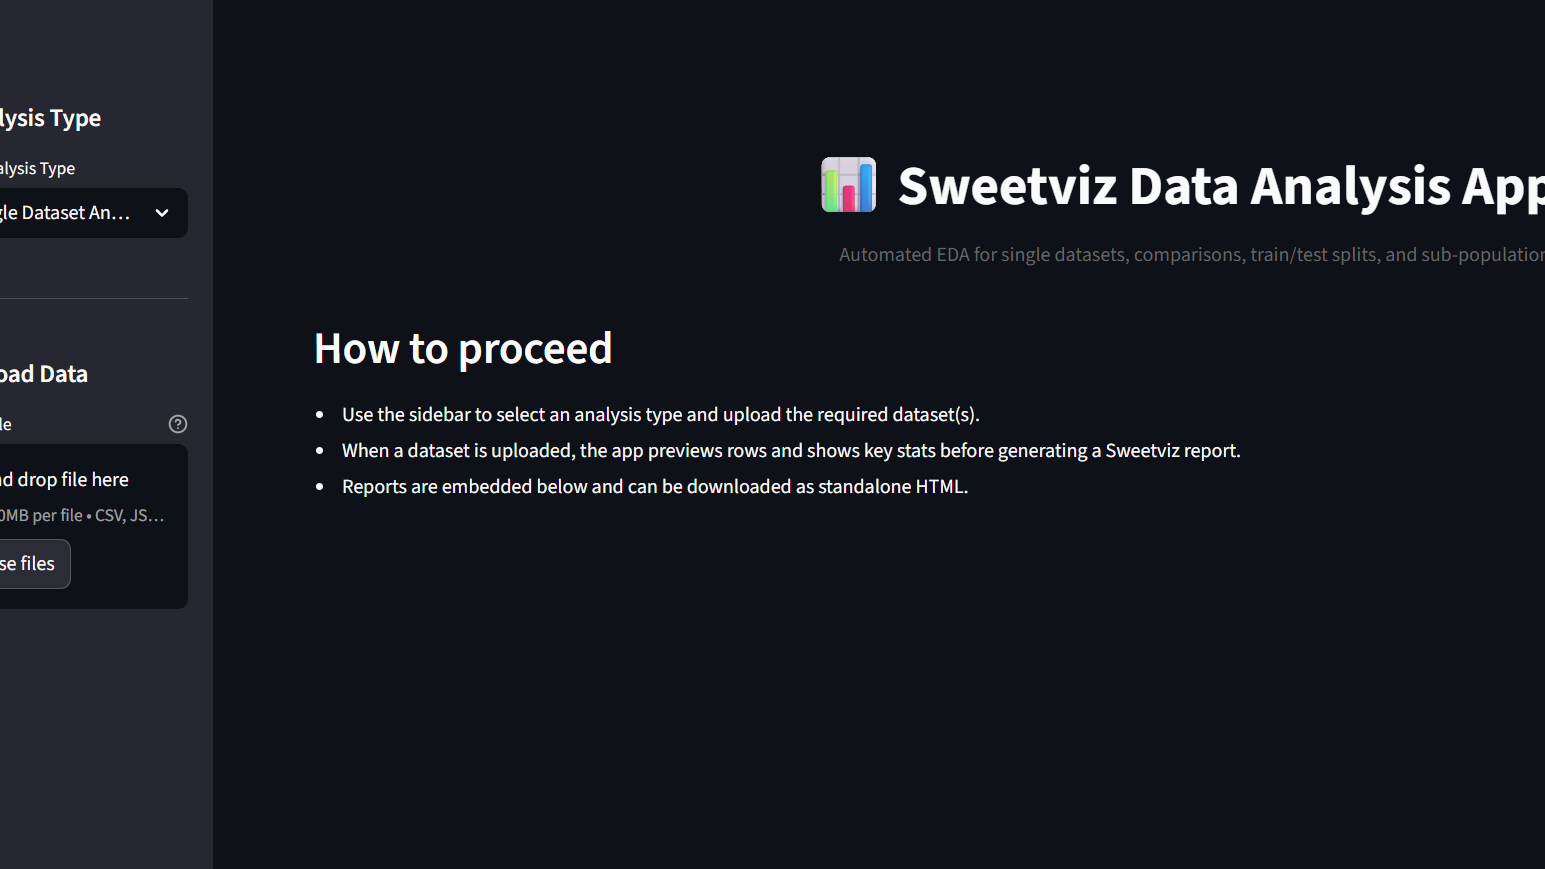
Sweetviz EDA App
An interactive web app that automates exploratory data analysis using Sweetviz and Streamlit.
Tech: Python, Streamlit, Pandas
Added: Oct 2025
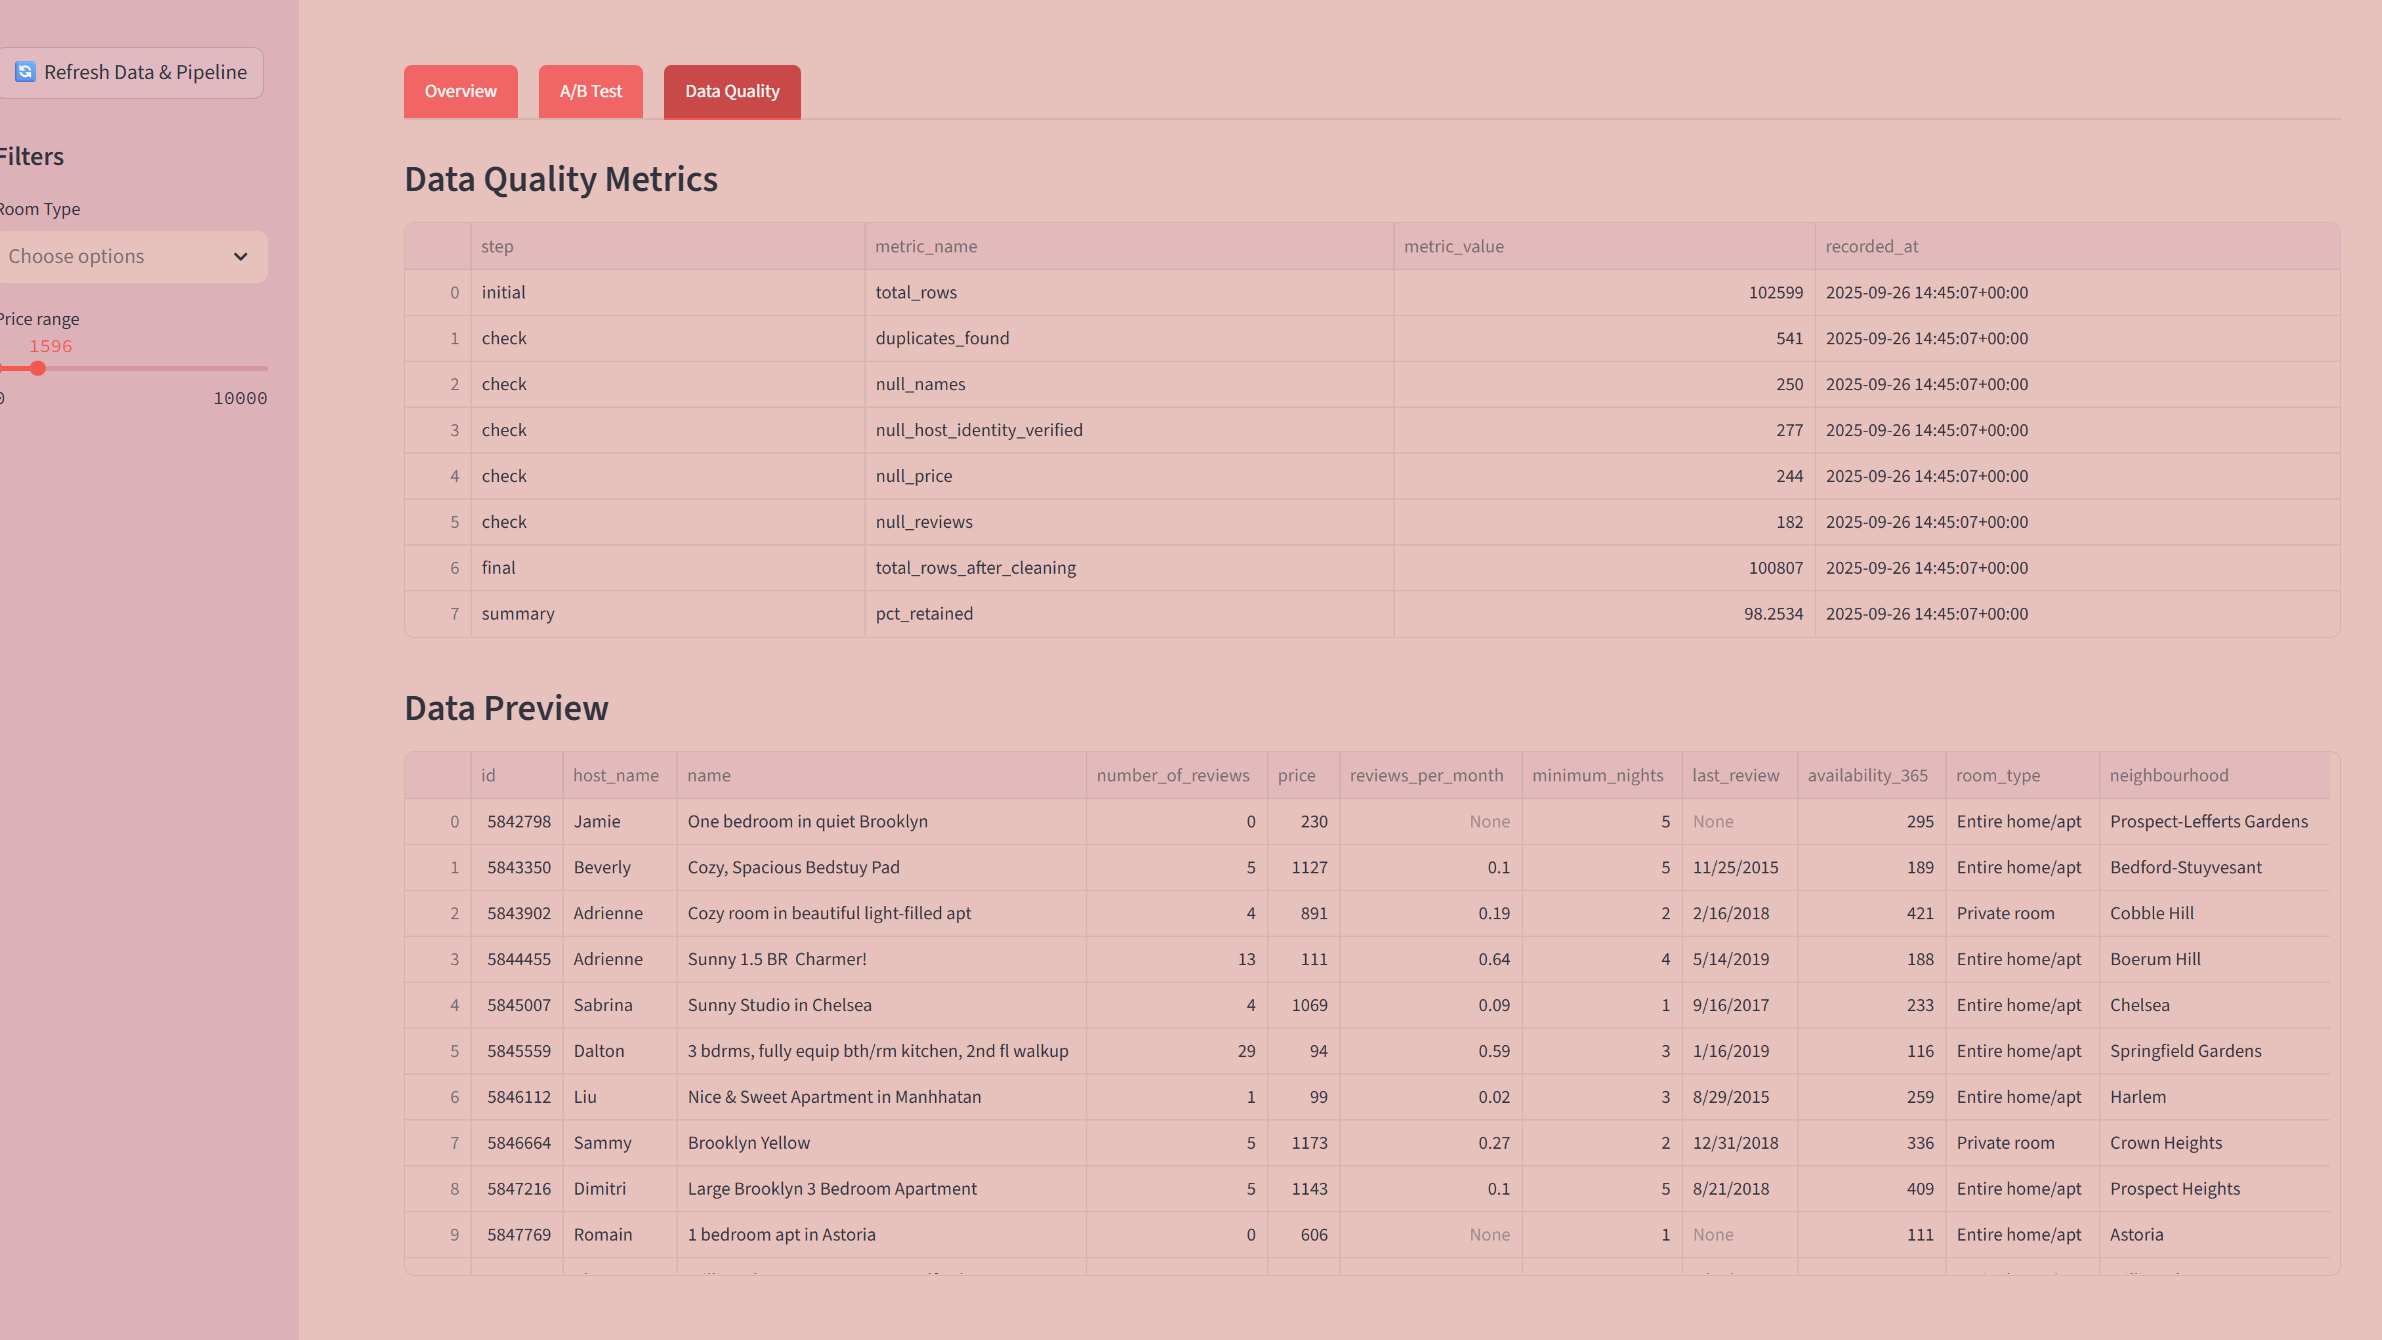
A/B Testing simulation
This project offers an interactive dashboard built in Streamlit that explores Airbnb listing data, simulates feature-level A/B tests, and monitors data quality.
Tech: Python, SciPy, Plotly, Flask
Added: Oct 2025
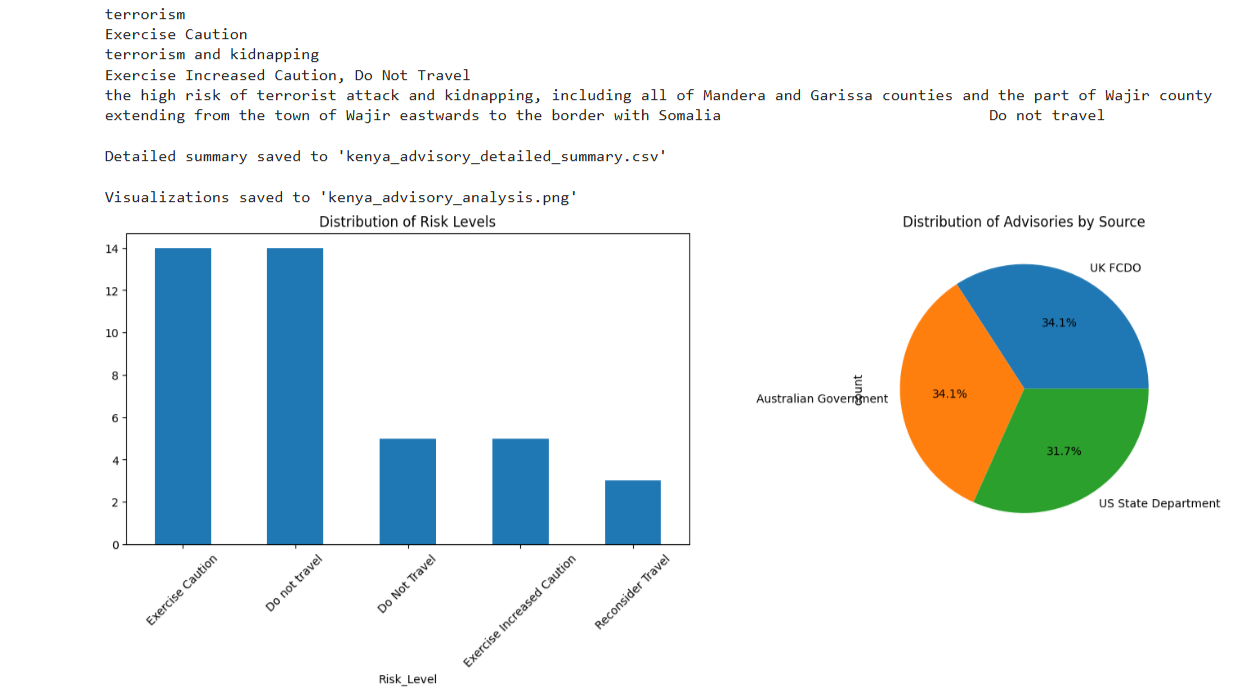
Kenya Travel Risk Mapper
A tool to map and analyze travel risks across Kenya using public datasets and APIs.
Tech: Python, GeoPandas, Folium, Plotly
Added: Jan 2025
More projects are in progress — including open-source tools for field data systems, automation, and ecological analytics.